
티스토리 뷰
Jenkins와 Sonarqube 연동을 하려면 일단 Jenkins와 Sonarqube가 설치가 되어 있어야 한다. 각각의 설치 과정은 생략하도록 하겠다. 이 두개의 어플리케이션이 설치가 되어 있다는 가정하에 설명을 하도록 하겠다.
Sonarqube 에서 해줘야 할일
Jenkins와 Sonarqube 연동은 token으로 한다. Jenkins에서 Sonarqube를 호출하여 작업을 하므로 token의 발행 주체는 Sonarqube이다. 따라서 Sonarqube에서 token을 생성을 해주도록 한다.
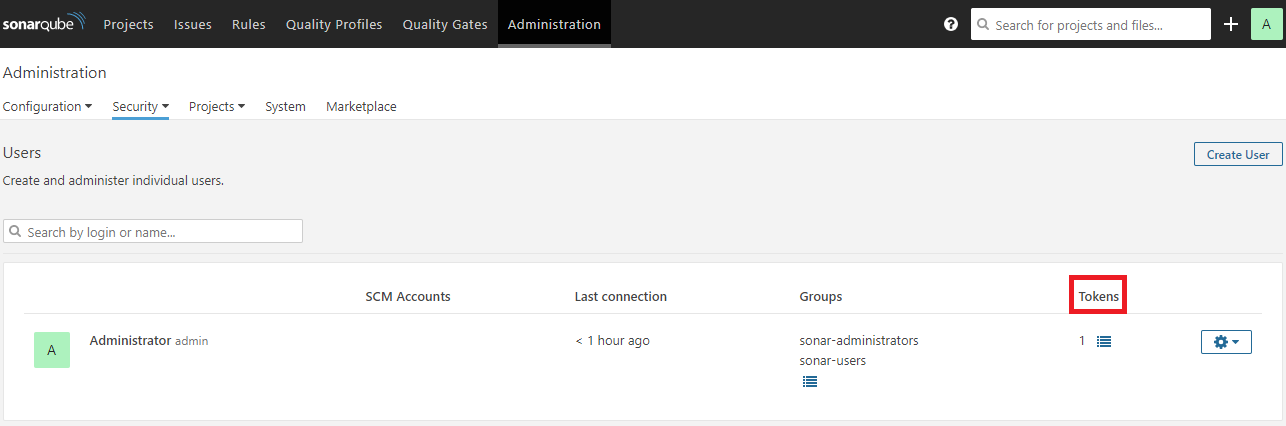
token 생성은 Administration > Security > User > Tokens
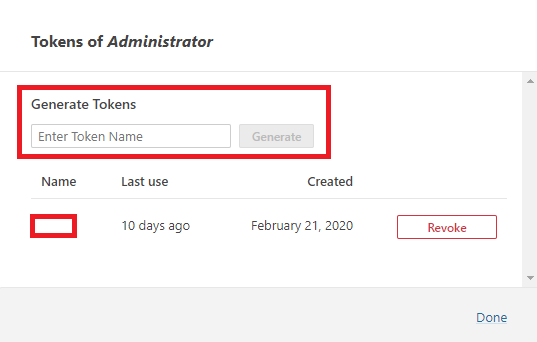
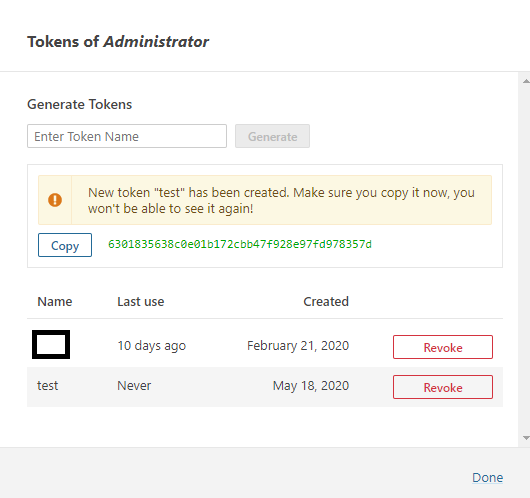
token 의 이름은 아무거나 집어 넣고 Generate 를 눌러 생성을 해준다. test 라는 token name을 넣고 생성을 했고 녹색의 문자열로 token이 생성되었다. 이 값을 잘 가지고 있자.
Jenkins 에서 해줘야 할일
Jenkins에서는 일단 SonarQube Scanner plugin을 설치를 합니다. 물론 Sonarqube Scanner 도 설치가 되어 있어야 합니다. 설치가 완료가 되었다면
Jenkins 관리 > Global Tool Configuration > Sonarqube Scanner > Add Sonarqube Scanner
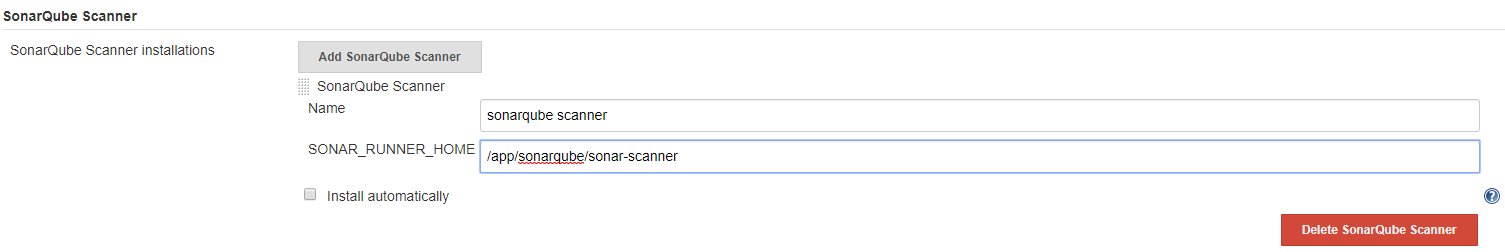
Name은 대충 넣고 SONAR_RUNNER_HOME 에서 Sonarqube Scanner가 설치된 경로를 입력해준다.
그 다음은 Jenkins 관리 > 시스템 설정 > Sonarqube servers
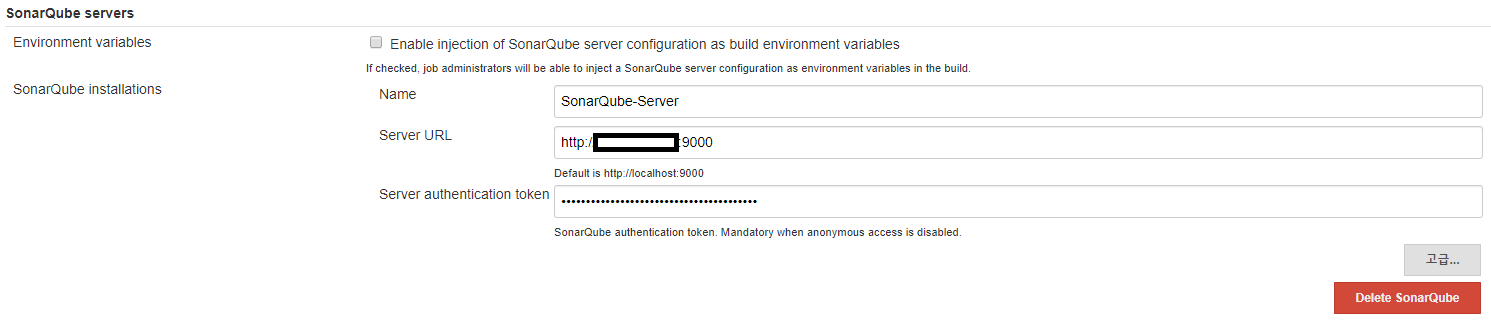
Server URL에 설치된 Sonarqube의 URL을 넣어준다. 그리고 Server authentication token 에 아까 생성해 놓은 값을 집어 넣는다. 여기까지 한다면 일단 연동 준비는 끝난거다.
이제는 어떤 디렉토리에서 어떤 모듈을 Sonarqube를 통해 검사를 할건지 정하는 Sonarqube Scanner 스크립트를 작성을 해줘야 한다. 일단은 Job을 하나 생성하고 Build 에서 다음과 같이 작성해준다.
Job 생성 > Build > Execute SonarQube Scanner > Analysis properties
# Root project information
sonar.sourceEncoding=UTF-8
sonar.projectBaseDir=/app/build/test/
sonar.projectKey=test
sonar.projectName=test
sonar.projectVersion=1.0

# Some properties that will be inherited by the modules
sonar.sources=src
sonar.java.source=1.8
sonar.inclusions=**/*.java

# List of the module identifiers
sonar.modules=test-web, test-common, test-batch

# Properties can obviously be overriden for
# each module - just prefix them with the module ID
test-web.sonar.projectName=test-web
test-web.sonar.java.binaries=target/classes
test-web.sonar.java.libraries=/app/build/test/test-web/target/test-web-1.0.0/WEB-INF/lib

test-common.sonar.projectName=test-common
test-common.sonar.java.binaries=target/classes
test-common.sonar.java.libraries=/app/build/test/test-common/target/test-common-1.0.0/WEB-INF/lib

test-batch.sonar.projectName=test-batch
test-batch.sonar.java.binaries=target/classes
test-batch.sonar.java.libraries=/app/build/test/test-batch/target/lib
분석을 하기 원하는 모듈을 지정해서 이런식으로 등록해준다. 이렇게 만든 Job을 실행시켜 주면 Jenkins를 통해 Sonarqube 분석이 시작된다. 실행시켜보면
INFO: ------------- Run sensors on project
INFO: Sensor Zero Coverage Sensor
INFO: Sensor Zero Coverage Sensor (done) | time=1ms
INFO: Sensor Java CPD Block Indexer
INFO: Sensor Java CPD Block Indexer (done) | time=1834ms
INFO: SCM provider for this project is: svn
INFO: 1 files to be analyzed
INFO: 1/1 files analyzed
INFO: 42 files had no CPD blocks
INFO: Calculating CPD for 329 files
INFO: CPD calculation finished
INFO: Analysis report generated in 526ms, dir size=2 MB
INFO: Analysis report compressed in 1447ms, zip size=1 MB
INFO: Analysis report uploaded in 248ms
INFO: ANALYSIS SUCCESSFUL, you can browse http://sonarqubeURL:9000/dashboard?id=test
INFO: Note that you will be able to access the updated dashboard once the server has processed the submitted analysis report
INFO: More about the report processing at http://sonarqubeURL:9000/api/ce/task?id=AXHzU9n3F6w7w7qfftJb
INFO: Analysis total time: 2:16.467 s
INFO: ------------------------------------------------------------------------
INFO: EXECUTION SUCCESS
INFO: ------------------------------------------------------------------------
INFO: Total time: 2:19.625s
INFO: Final Memory: 17M/60M
INFO: ------------------------------------------------------------------------
WARN: Unable to locate 'report-task.txt' in the workspace. Did the SonarScanner succedeed?
Finished: SUCCESS
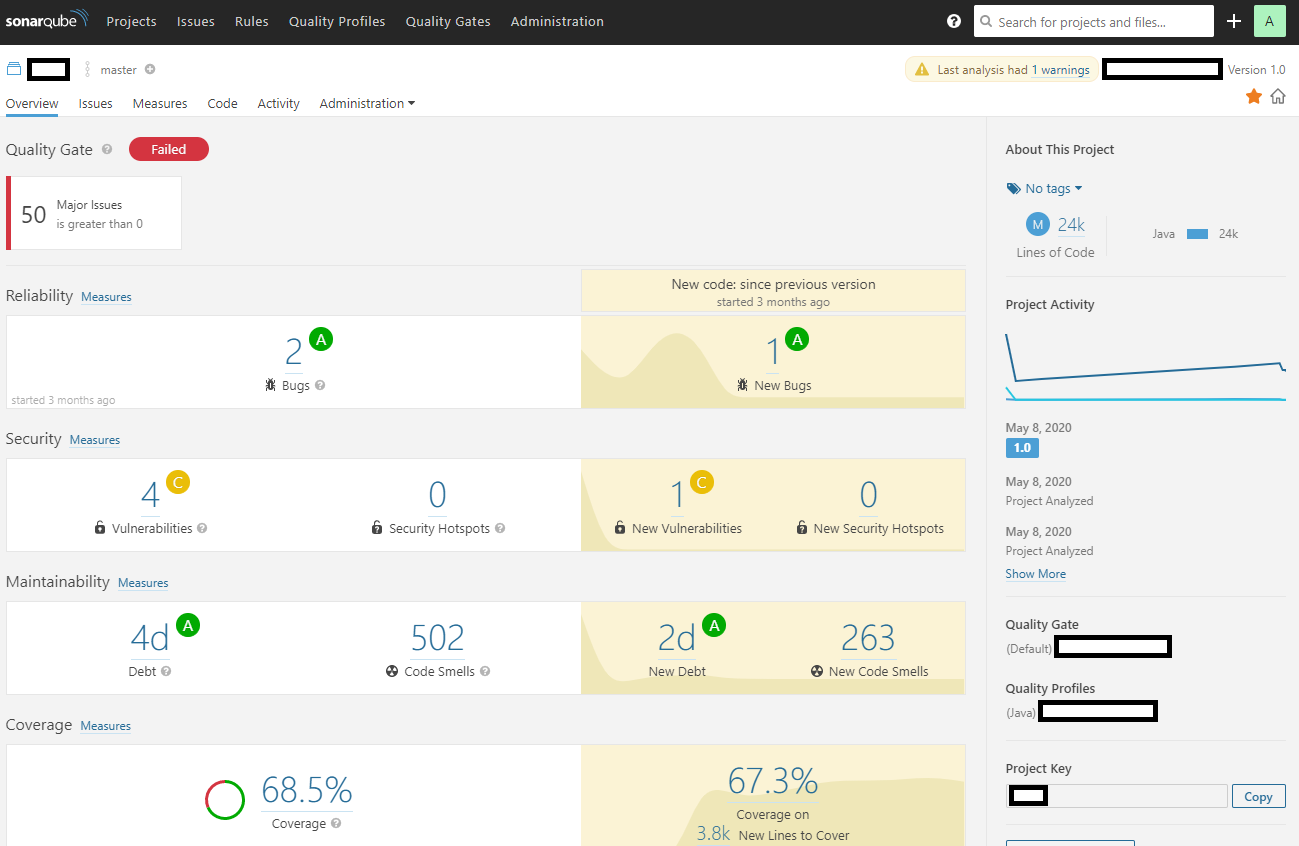
위와 같이 나오는데 SUCCESS 위에 나오는 http://sonarqubeURL:9000/dashboard?id=test 이 링크를 눌러서 들어가면 Sonarqube에서 프로젝트를 분석한 결과를 바로 볼수 있다.
Sonarqube에 들어가지 않고 Jenkins Dashboard에서 직접 Issues에 대해서 확인을 할수도 있다.
Jenkins > Dashboard tab > 보기수정 > Portlets at the bottom of the page (원하는 위치) > SonarQube Issues
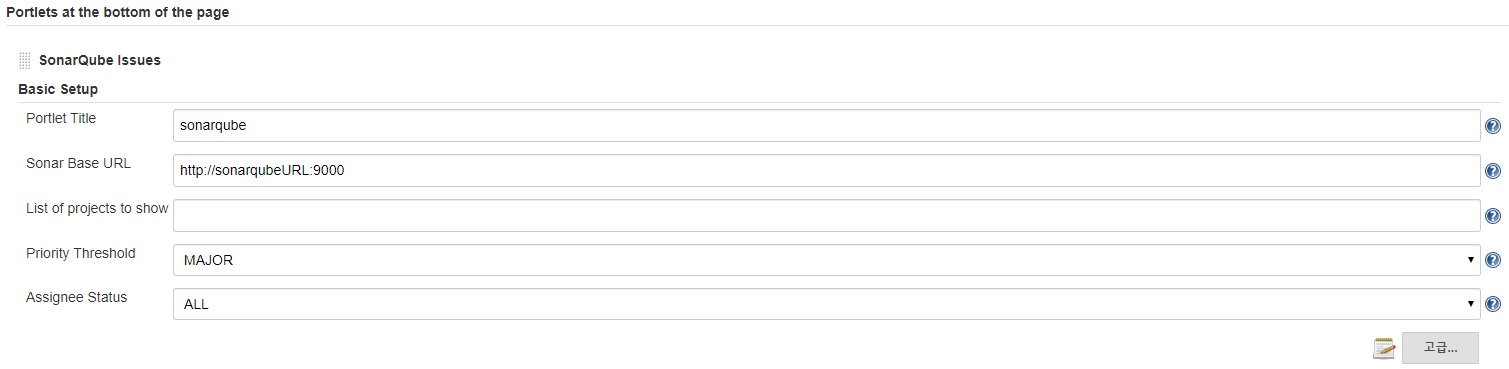
이렇게 설정한 후 Dashboard tab으로 돌아가서 보면 다음과 같이 간단히 이슈를 확인할 수 있다.
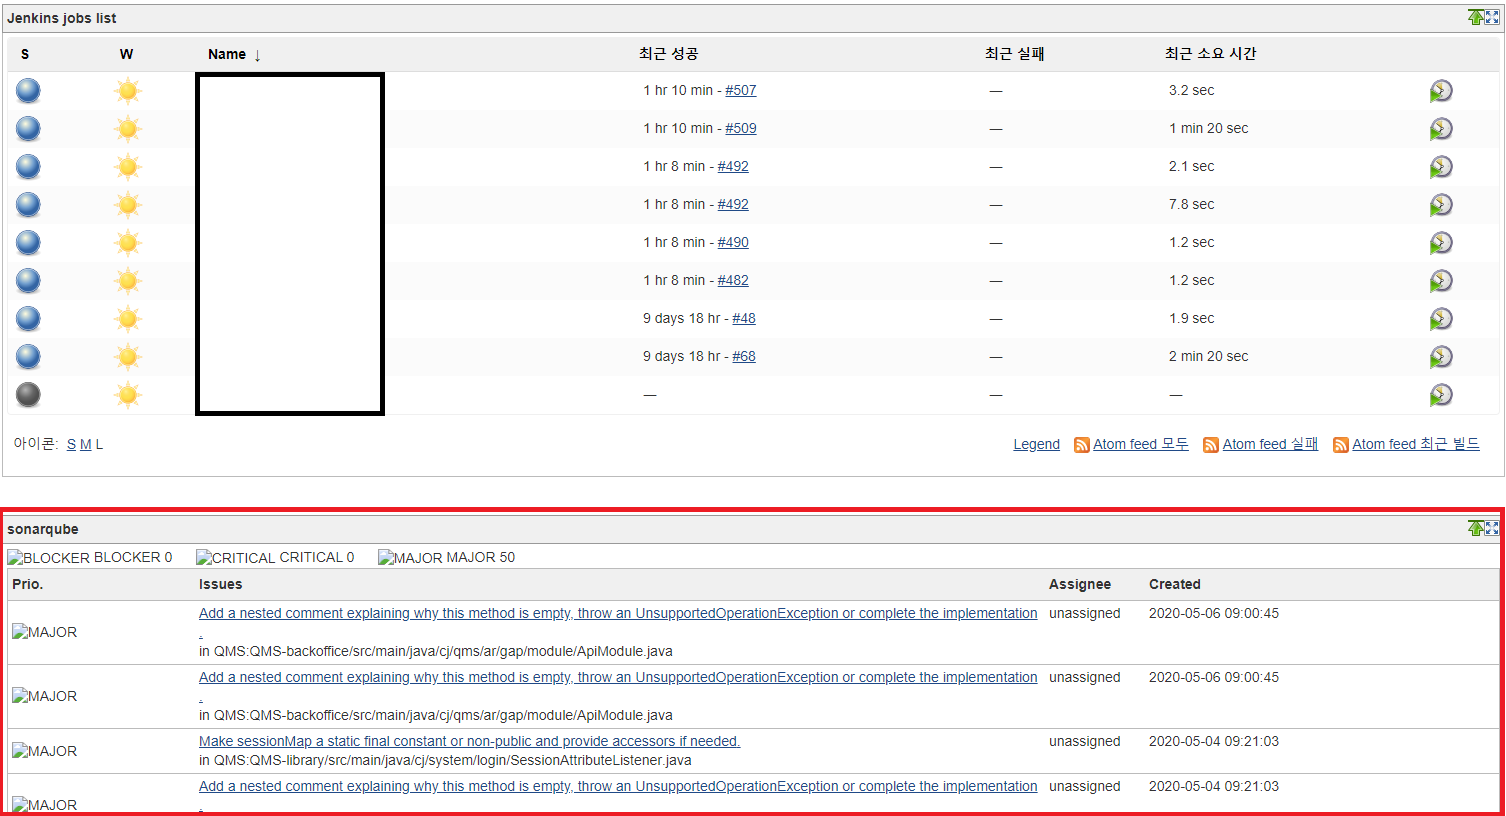
끝!
'CI,CD > Jenkins' 카테고리의 다른 글
| Jenkins에서 Build FAILURE 시 특정 위치에 로그 남기기 (0) | 2020.06.16 |
|---|---|
| Nexus에 deploy하고 Jenkins에서 deploy 된 목록 가지고 오기 (0) | 2020.06.11 |
| Jenkins에서 Spring Batch Scheduling 하기 (0) | 2020.06.03 |
| jenkins에서 svn tag를 이용해 build 하기 (0) | 2020.05.28 |
| Jenkins에 JaCoCo 연동하기 (0) | 2020.04.29 |